Classroom · Aviation Weather
Reading Aviation Weather: METARs & TAFs Explained
Learn to read a METAR the way experienced pilots actually do — not by memorizing codes, but by seeing the weather in the string. This lesson decodes the full anatomy of a METAR field by field, shows you how to find the ceiling and flight category, explains the TAF forecast and its change groups, and walks two real reports from raw text to a go/no-go decision — with an original diagram for every concept.
What is a METAR, and why it matters
A METAR is an observed aviation routine weather report — a snapshot of the actual weather at an airport at a specific moment, issued roughly once an hour (in practice, observed and transmitted in the 10 or so minutes before the hour). It is an observation, not a forecast: it tells you what a sensor or a human observer measured. When conditions change significantly between the scheduled hourly reports, a station files a SPECI — a special, off-schedule report — so you learn about a fast-moving change immediately instead of waiting for the next observation.
METARs matter because they are the ground truth behind every preflight decision. A forecast can be optimistic; the METAR tells you what is genuinely happening at your departure, destination, and alternate right now. It is written in a terse, standardized international code so that a report from Denver, Frankfurt, or Tokyo is read the same way. Once you can read it fluently, you stop translating abbreviations and start seeing the weather — the wind, the ceiling, the trend toward fog — directly in the string.
The good news: a METAR is not random. It is always read left to right in a fixed order, and every element has a predictable shape. Learn the order once and any report becomes a checklist you run top to bottom.
Key idea METAR = observed weather, hourly. SPECI = special, off-schedule report when conditions change. Everything reads left to right in the same order, every time.
The full anatomy of a METAR, in order
Here is a real, fair-weather report from Denver. Below it, the same string is broken into its twelve numbered elements. Every METAR follows this sequence; some elements (like RVR or a COR modifier) simply don’t appear when they aren’t needed. We color-code the fields here and reuse the exact same colors in the diagram, the code chips, and both worked decodes later — one visual grammar for the whole lesson.
| # | Element | Example | Meaning |
|---|---|---|---|
| 1 | Report type | METAR / SPECI | Routine hourly, or an off-schedule special. |
| 2 | Station (ICAO) | KDEN | Four-letter airport identifier. |
| 3 | Day + time (Zulu) | 141853Z | 14th of month, 1853 UTC. |
| 4 | Modifier | AUTO / COR | Fully automated, or a correction. Absent = normal. |
| 5 | Wind | 09008KT | Direction (true) and speed in knots. |
| 6 | Visibility | 10SM | Prevailing visibility in statute miles. |
| 7 | RVR | R06/2400FT | Runway visual range (when reported). |
| 8 | Present weather | TSRA | Precipitation and obscurations now occurring. |
| 9 | Sky condition | FEW070 BKN250 | Cloud layers by coverage and height. |
| 10 | Temp / dewpoint | 24/09 | In °C; M = minus. |
| 11 | Altimeter | A3012 | Setting in inches of mercury. |
| 12 | Remarks | RMK … | Everything after RMK: sensor type, pressure, more. |
Wind: direction, speed, gusts, and variability
Wind is coded as dddssKT — three digits of direction, two (or three) digits of speed, then KT for knots. The direction is degrees true (the tower converts to magnetic when it reads you the wind on frequency, but the METAR text itself is true). So 09008KT is wind from 090° true at 8 knots. Wind always names the direction it blows from.
Gusts matter for takeoff and landing performance and for your personal crosswind limits — a steady 15 is a very different runway than 15 gusting 25. When the direction is genuinely swinging you’ll see a variable range appended, such as 18010KT 150V210; if the whole wind is light and shifting, it collapses to VRB. But the runway you use only “feels” the part of the wind along and across it — so resolve the reported wind onto your runway heading before you commit:
Wind → runway math Those two numbers are what you actually fly: the crosswind component = wind speed × sin(angle between wind and runway), and the headwind component = wind speed × cos(angle). A 30° offset keeps roughly 85% of the wind as headwind and about half as crosswind. Run the real figures — including the gust — through the takeoff & landing performance calculator before you commit to a short, wet, or gusty runway.
Visibility & RVR
In the United States, prevailing visibility is reported in statute miles followed by SM: 10SM is ten statute miles, 3SM is three. Fractions appear as you’d write them — 1/2SM, 1 1/2SM. A leading M here means “less than”: M1/4SM is less than a quarter mile. (Watch that M — in the temperature field the same letter means “minus.” Context tells you which.)
RVR — Runway Visual Range — is a separate, instrument-measured horizontal visibility down a specific runway, reported in feet when visibility is low. R06/2400FT reads: on runway 06, the RVR is 2,400 feet. RVR only appears in poor conditions and governs many instrument-approach landing minimums, so its presence alone is a signal the weather is marginal.
Read it right M = less than in the visibility/RVR fields, but minus in the temperature field. Same letter, two jobs, decided entirely by which element you’re in.
Present-weather codes (with a full decode key)
Present weather is where new pilots feel lost — but the codes are built from a simple grammar. Read each group as intensity → descriptor → phenomenon and chain the pieces together. +SHRA is heavy (+) showers (SH) of rain (RA). TSRA is a thunderstorm (TS) with rain (RA). FZRA is freezing (FZ) rain (RA). -DZ is light drizzle. Learn the grammar once and you can read combinations you’ve never seen before.
Step 1 — Intensity & proximity (the prefix)
Step 2 — Descriptor
Step 3 — Phenomenon
| Precipitation | Obscuration | Other |
|---|---|---|
| DZ Drizzle | FG Fog | PO Dust/sand whirls |
| RA Rain | BR Mist | SQ Squall |
| SN Snow | HZ Haze | FC Funnel cloud |
| SG Snow grains | FU Smoke | SS Sandstorm |
| GR Hail | VA Volcanic ash | |
| GS Small hail | DU / SA Dust / sand | |
| PL Ice pellets |
Decode drill +TSRAGR → thunderstorm (TS) with heavy (+) rain (RA) and hail (GR) — the intensity qualifier applies to the precipitation. VCFG → fog in the vicinity, not at the field yet. Build the picture piece by piece and it always resolves.
Sky cover & how to find the ceiling
Sky condition describes cloud layers from the ground up, each as a coverage code plus a height in hundreds of feet above ground level (AGL). Coverage is measured in eighths of the sky (oktas): picture the sky dome divided into eight parts and count how many hold cloud. BKN012 means a broken layer (5–7 eighths) at 1,200 feet AGL.
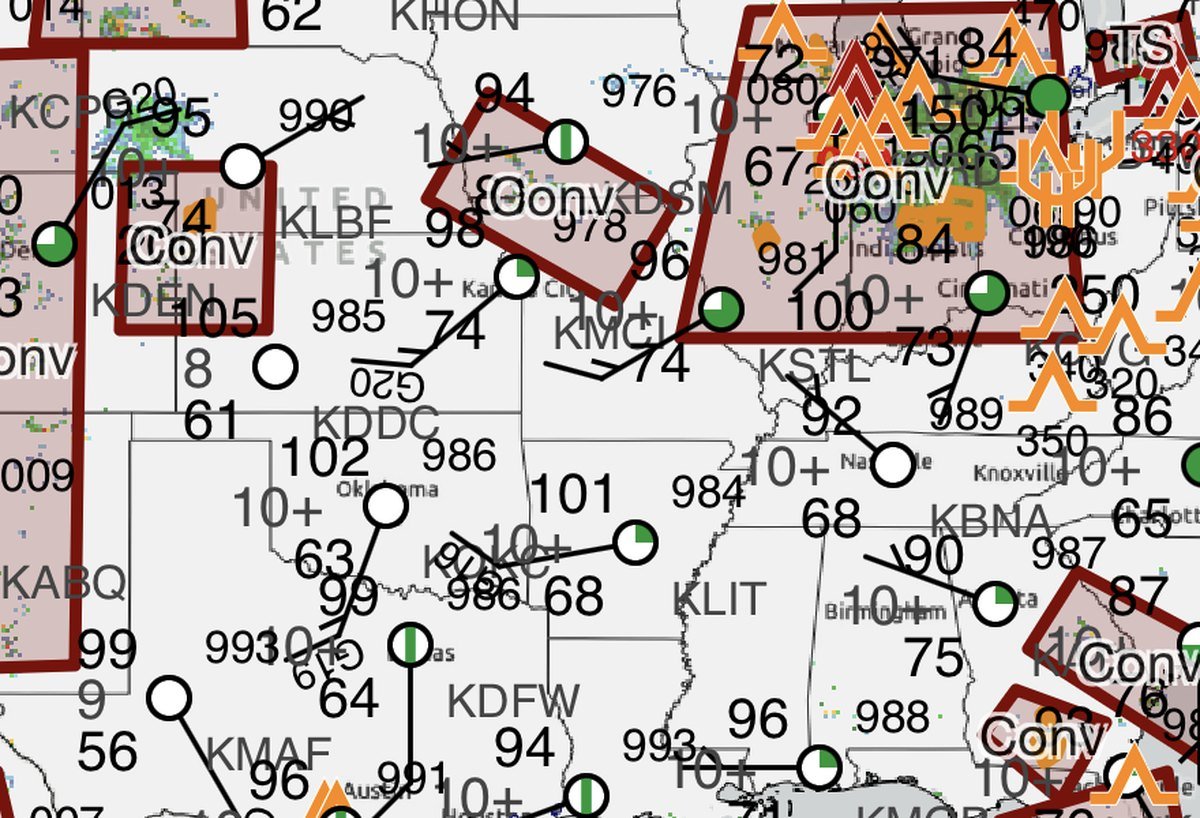
Convective clouds get a suffix: CB for cumulonimbus (thunderstorm cloud) and TCU for towering cumulus. So BKN040CB is a broken layer at 4,000 feet made of thunderstorm cloud — a very different day from plain BKN040.
Finding the ceiling: cross out FEW and SCT, ignore anything above
The ceiling is the height of the lowest BROKEN or OVERCAST layer (or a VV value). FEW and SCT are never ceilings — there’s enough gap in the sky to be considered “below” them. Scan upward from the ground, skip past every FEW and SCT, and stop at the first BKN or OVC. That layer is your ceiling — and every layer above it is irrelevant.
The same three-step scan handles any report. In our Denver example FEW070 SCT120 BKN250, you cross out FEW and SCT and the ceiling is 25,000 ft — the first (and only) broken-or-overcast layer. In a low-ceiling case like SCT006 BKN012 OVC030, you skip the SCT layer, stop at BKN012 for a 1,200 ft ceiling, and the OVC030 above it doesn’t matter. Read up, skip FEW/SCT, stop at the first BKN/OVC.
Reality check Our clean FEW070 SCT120 BKN250 example is a teaching idealization. Automated ASOS/AWOS stations only sense cloud up to about 12,000 ft and rarely report layers above that, so a real automated (AO2) report often shows fewer — or no — high layers.
Self-check Given SCT008 BKN015 OVC030, what is the ceiling?
Show answer
1,500 ft. Skip SCT008 (scattered is not a ceiling); the lowest broken-or-overcast layer is BKN015 = 1,500 ft AGL. The OVC030 above it doesn’t matter — the lowest one wins.
Temperature, dewpoint & the spread
Temperature and dewpoint are reported in degrees Celsius, separated by a slash, with M meaning minus: 24/09 is 24 °C over a 9 °C dewpoint, and M04/M07 is −4 °C over −7 °C. The single most useful thing this field gives you isn’t either number alone — it’s the spread between them.
The dewpoint is the temperature to which the air must cool to become saturated. A small temperature–dewpoint spread means the air is close to saturation, so fog, mist, and low cloud become likely — especially overnight and near dawn as the temperature falls toward the dewpoint. A wide spread means dry air and generally better visibility.
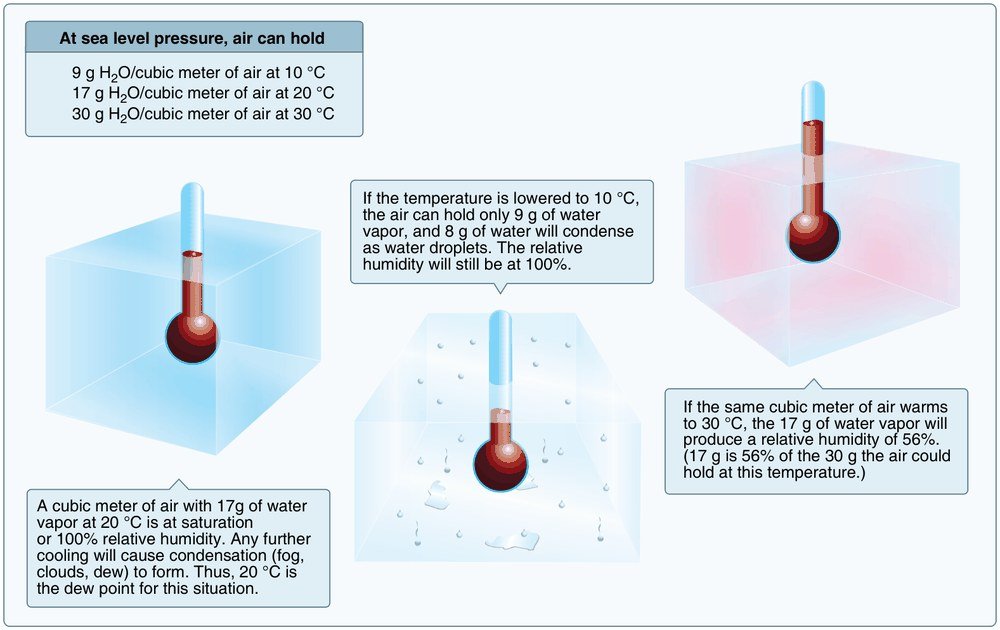
This is the field that lets you anticipate. If an evening METAR shows a 2 °C spread and calm winds, the morning may well bring fog before your planned departure — a forecast the numbers hand you for free.
Altimeter setting
In the U.S. the altimeter setting is coded as A followed by four digits of inches of mercury with the decimal implied: A3012 = 30.12 inHg, and A2992 = 29.92 inHg. You dial this into the Kollsman window so your altimeter reads true field elevation. Internationally you’ll see Q plus hectopascals instead — Q1013 = 1013 hPa.
Standard atmosphere (ISA) At sea level, standard conditions are 15 °C and 29.92 inHg. Pressure and temperature away from those values drive density altitude — the number that quietly steals climb and takeoff performance on a hot, high day. Turn a METAR’s altimeter and temperature into density altitude with the density altitude calculator.
Altimeter setting is not an altitude — it’s the pressure reference. But it feeds directly into performance: pair it with weight and balance and runway numbers using the weight & balance calculator and the performance calculator before a high-density-altitude departure.
Remarks (RMK)
Everything after RMK is supplementary detail. Two you’ll see constantly identify the station type: AO2 is an automated station with a precipitation-discriminating sensor (it can tell rain from snow), and AO1 is automated without one. Another common entry is sea-level pressure, coded SLPppp: SLP184 decodes to 1018.4 hPa (prepend a 9 or 10 to land nearest 1000).
Remarks are where a station adds nuance a machine or observer thought you should know — pressure trends, when a thunderstorm began, peak wind gusts. Don’t skip them; they often carry the detail that tips a marginal decision.
The four flight categories
Ceiling and visibility together sort every report into one of four flight categories — a fast, standardized read on how much of a challenge the weather poses. You apply both the ceiling and the visibility criteria and take the more restrictive (worse) of the two.
VFR
Ceiling greater than 3,000 ft AND visibility greater than 5 SM.
MVFR
Ceiling 1,000–3,000 ft and/or visibility 3–5 SM.
IFR
Ceiling 500 to <1,000 ft and/or visibility 1 to <3 SM.
LIFR
Ceiling <500 ft and/or visibility <1 SM.
The asymmetry that trips people up VFR needs BOTH a high ceiling AND good visibility. The three lower categories trigger on EITHER ceiling or visibility — whichever is worse. A 4,000-ft ceiling (VFR) with 2 SM visibility (IFR) is IFR, because visibility is the more restrictive of the two.
METAR vs TAF, and TAF change groups
A METAR tells you what’s happening now. A TAF — Terminal Aerodrome Forecast — tells you what’s expected. A TAF is a forecast for the area within roughly a 5-statute-mile radius of the airport, valid for 24 to 30 hours, and it reuses almost all the same codes as a METAR. The big new idea is change groups: the TAF states a base forecast, then layers on how and when conditions are expected to shift.
| METAR | TAF | |
|---|---|---|
| What it is | Observation (what happened) | Forecast (what’s expected) |
| Area | The station itself | ~5 SM radius of the airport |
| Timing | ~Hourly (SPECI as needed) | Valid 24–30 h, updated ~4×/day |
| Time field | ddhhmmZ issue time | DDHH/DDHH valid period |
The change groups, on one timeline
Four change groups describe four different shapes of change. This is exactly where students conflate them — so here they are on a single timeline: FM is a clean step, BECMG is a ramp across a window, TEMPO is brief spikes, and PROB is a dashed “maybe” block.
| Group | Means | Read it as |
|---|---|---|
| FM | From | A rapid, lasting change starting at a stated time, written with six digits as FMDDHHMM (e.g. FM142000 = day 14, 2000Z). Everything before is replaced. |
| BECMG | Becoming | A gradual change over a window (e.g. BECMG 1502/1504) that then persists. |
| TEMPO | Temporary | Brief fluctuations, each lasting <1 h and covering <½ the period — comes and goes. |
| PROB30/40 | Probability | A 30% or 40% chance of the stated conditions in that period. |
Here’s a TAF that uses all four:
Read top to bottom: valid from the 14th at 1800Z to the 15th at 2400Z; base conditions light east wind and more than 6 SM; from 2000Z the wind veers and picks up; temporarily between 2000–2300Z mist may drop visibility to 5 SM; the wind gradually becomes southerly early on the 15th; and there’s a 30% chance of thunderstorms with rain from 0600–0900Z. Note P6SM means “greater than 6 SM.”
Where to get aviation weather
METARs and TAFs are free and everywhere. Get them before every flight from a source you trust, and cross-check the observation against the forecast.
ATIS, ASOS, and AWOS give you the current observation over the radio as you approach a field — the same data as the METAR, spoken aloud. On the ground, decode and sanity-check any raw report instantly with the METAR decoder.
Two worked decodes, token by token
Now we run the whole checklist on two contrasting reports — a clear VFR day and a low-IFR morning — using the same field colors from the anatomy diagram, so the structure of each report reads with one visual grammar.
Example 1 — a clear, VFR day at Denver
| Token | Decoded |
|---|---|
| KDEN | Denver International Airport. |
| 141853Z | 14th of the month, 1853 UTC (Zulu). |
| 09008KT | Wind from 090° true at 8 knots — a light east wind. |
| 10SM | Prevailing visibility 10 statute miles. |
| FEW070 | Few clouds at 7,000 ft AGL. (Skip — not a ceiling.) |
| SCT120 | Scattered at 12,000 ft AGL. (Skip — not a ceiling.) |
| BKN250 | Broken at 25,000 ft AGL — this is the ceiling (lowest BKN/OVC). |
| 24/09 | Temp 24 °C, dewpoint 9 °C. Spread 15 °C → dry air. |
| A3012 | Altimeter 30.12 inHg. |
| RMK AO2 | Automated station with precipitation sensor. |
| SLP184 | Sea-level pressure 1018.4 hPa. |
Category (worse of two): ceiling 25,000 ft is VFR (>3,000) and visibility 10 SM is VFR (>5). Both rows are VFR, so the report is VFR. A textbook good day: light wind, high thin cloud, dry air.
Example 2 — low IFR at San Francisco
| Token | Decoded |
|---|---|
| KSFO | San Francisco International Airport. |
| 141856Z | 14th, 1856 UTC. |
| 20015G25KT | Wind from 200° at 15 knots, gusting 25 — a gusty south-southwest wind. |
| 3SM | Visibility 3 statute miles. |
| BR | Mist (visibility reduced by suspended moisture). |
| BKN006 | Broken at 600 ft AGL — this is the ceiling. |
| OVC012 | Overcast at 1,200 ft AGL. (Above the ceiling — doesn’t change it.) |
| 14/12 | Temp 14 °C, dewpoint 12 °C. Spread just 2 °C → near saturation, consistent with the mist. |
| A2989 | Altimeter 29.89 inHg. |
| RMK AO2 | Automated station with precipitation sensor. |
Category (worse of two): the ceiling is 600 ft, which falls in the 500-to-<1,000 ft band — that’s IFR. Visibility 3 SM sits at the bottom of the MVFR band (3–5 SM). You take the worse of the two rows, so the IFR ceiling outranks the MVFR-boundary visibility and the report is IFR. Notice the 2 °C spread had already warned of the low, moist conditions before we computed anything — and it warns that if the temperature nudges toward the dewpoint, this could sink toward LIFR fog.
Self-check In Example 2, why isn’t the report MVFR just because visibility is 3 SM?
Show answer
Because the ceiling of 600 ft is IFR, and you always assign the category from the more restrictive of ceiling and visibility. The IFR ceiling outranks the MVFR-boundary visibility.
Common mistakes & misconceptions
These are the errors that trip up almost every student pilot at least once. Get ahead of them.
Myth “FEW and SCT layers set the ceiling.” They do not. Only the lowest BROKEN or OVERCAST layer (or VV) is a ceiling. Skip right past FEW and SCT when hunting for it.
Myth “M always means minus.” Only in the temperature field. In the visibility field, M means less than (M1/4SM = under a quarter mile).
Myth “The time is local.” METAR times are Zulu (UTC), marked by the trailing Z. Convert to local before you reason about how old the report is or when a change happens.
Myth “The altimeter is an altitude.” A3012 is a pressure setting (30.12 inHg) you dial in — not feet, not altitude.
Myth “Cloud heights are MSL.” METAR cloud bases are AGL (above ground level). A ceiling of 006 is 600 ft above the field, not above sea level.
Myth “A METAR is a forecast.” A METAR is an observation. For expected conditions you need the TAF — and its change groups tell you when things shift.
How this drives a go/no-go decision
Reading a METAR is only useful if it changes what you do. Here’s the reasoning chain from raw text to decision, the way a careful pilot runs it:
- Category first. Derive VFR/MVFR/IFR/LIFR at departure, destination, and alternate. Does it match your ratings, currency, and the aircraft’s equipment?
- Wind & gusts. Resolve the wind onto the runway heading and compare the crosswind component (and gust factor) to your personal limit. Run the numbers through the performance calculator.
- Trend from the spread. A small temp–dewpoint spread plus a falling temperature warns of fog forming before you arrive — even if it’s clear now.
- Density altitude. Hot, high, or low-pressure? Convert temp and altimeter to density altitude with the density altitude tool and confirm you’ll actually climb.
- Weight & balance. Verify loading against the day’s performance with the weight & balance calculator.
- Forecast the window. Read the TAF across your whole flight window — a TEMPO or PROB30 for thunderstorms at your ETA is a no-go even if the current METAR is calm.
✓ Signals that lean GO
- VFR category with margin at every airport on the route.
- Wind and crosswind component inside your personal limit.
- Wide temp–dewpoint spread — dry, stable air.
- Density altitude your aircraft comfortably handles.
- TAF steady or improving across your window.
✗ Signals that lean NO-GO
- IFR/LIFR ceiling or visibility beyond your rating or currency.
- Gusts or crosswind past your limit; TS/CB present or nearby.
- Tiny spread + falling temp — fog brewing.
- Density altitude that erases climb or runway margin.
- TEMPO/PROB thunderstorms or low IFR at your ETA.
Bottom line The METAR sets the scene, the TAF forecasts the change, and your personal minimums make the call. If any leg is worse than your training, currency, or the aircraft supports — it’s a no-go, and that’s a good decision.
Frequently asked questions
What is the difference between a METAR and a SPECI?
A METAR is the routine, roughly hourly observation (taken in the 10 or so minutes before the hour). A SPECI is a special, off-schedule report issued when conditions change significantly between the scheduled observations — a wind shift, a sudden drop in visibility, a thunderstorm beginning. Both use identical formatting; only the trigger differs.
How do I find the ceiling in a METAR?
The ceiling is the height of the lowest broken (BKN) or overcast (OVC) layer, or a vertical visibility (VV) value into an obscuration. Few (FEW) and scattered (SCT) layers are never ceilings, and any layer above the lowest BKN/OVC is ignored. In SCT008 BKN015, the ceiling is 1,500 ft AGL.
Are METAR cloud heights AGL or MSL?
Above ground level (AGL). Cloud heights are given in hundreds of feet above the airport, so BKN006 is a broken layer 600 ft above the field.
What do the flight categories VFR, MVFR, IFR, and LIFR mean?
VFR: ceiling >3,000 ft and visibility >5 SM. MVFR: ceiling 1,000–3,000 ft and/or visibility 3–5 SM. IFR: ceiling 500 to <1,000 ft and/or visibility 1 to <3 SM. LIFR: ceiling <500 ft and/or visibility <1 SM. Apply both ceiling and visibility and use the more restrictive result.
What does the M mean in a METAR?
It depends on the field. In the temperature/dewpoint field, M means minus (M04/M07 = −4 °C / −7 °C). In the visibility and RVR fields, M means “less than” (M1/4SM = less than a quarter mile).
What is RVR in a METAR?
RVR is Runway Visual Range — an instrument-measured horizontal visibility down a specific runway, reported in feet when visibility is low. R06/2400FT means runway 06 has an RVR of 2,400 feet. It governs many instrument-approach landing minimums, so its presence signals marginal weather.
What does TSRA mean?
Thunderstorm (TS) with rain (RA). Weather codes chain as intensity → descriptor → phenomenon, and the intensity applies to the precipitation — so +TSRA is a thunderstorm with heavy rain and FZRA is freezing rain.
Why does a small temperature–dewpoint spread matter?
The dewpoint is the temperature at which the air becomes saturated. A small spread means the air is close to saturation, so fog, mist, and low cloud become likely — especially overnight as temperatures fall toward the dewpoint. A wide spread indicates dry air and better visibility.
What is the difference between a METAR and a TAF?
A METAR is an observation of current weather at the station. A TAF (Terminal Aerodrome Forecast) is a forecast for about a 5-statute-mile radius of the airport, valid 24–30 hours, using change groups (FM, BECMG, TEMPO, PROB30/40) to describe expected changes over time.
What do FM, BECMG, TEMPO, and PROB mean in a TAF?
FM (from) marks a rapid, lasting change at a stated time, written with six digits as FMDDHHMM (e.g. FM142000). BECMG (becoming) is a gradual change over a window that then persists. TEMPO (temporary) is brief fluctuations, each under an hour and covering less than half the period. PROB30/PROB40 give a 30% or 40% probability of the stated conditions.
Where can I get METARs and TAFs?
From aviationweather.gov, by phone at 1-800-WX-BRIEF, through apps like ForeFlight, and over the radio via ATIS (towered fields) or ASOS/AWOS automated broadcasts. You can also decode any raw report with our METAR decoder.
Is the wind in a METAR true or magnetic?
The wind direction in the METAR text is degrees true. When a tower or ATIS reads you the wind on frequency, it is converted to magnetic to match your runway headings.
Ready to practice? Decode a live report in the METAR decoder, drill codes with the weather flashcards, and carry the numbers into the performance calculator, weight & balance, and density altitude tools before you fly.